More than the numbers
Tore Vaaland · 19 October 2026
A quarterly report is the people running a company reporting to the people who own it. The numbers say what happened. The words are management explaining why, and what they expect next. I'm one of the owners reading it, and how I read it becomes my own theory about where the company is headed.
Then I try to break it, before I invest and the whole time I'm invested. I ask the AI to break it too. I read about the sector, not just the company: what are the risks for everyone in this business, and why this company over one of its competitors? There are always bears, and on the forums they're often the loudest. If I'm going to take the other side of them, I want to know exactly why.
Everything I think is relevant goes into the app: my own notes, news articles, interviews, presentations, even screenshots from social media. The reports are the backbone of it all, and this post is about what the app pulls out of them.
The numbers
The numbers may be the dull part, but everything else in the app stands on them, so this is where I'm strictest.
Right now I'm re-reading every report with a new table reader. It doesn't ask an AI what a figure is. Code reads the report's own tables and ties every number to its place on the page: the row, the column and the period. Then it checks the number against the text of the PDF itself, so I know it is really there.
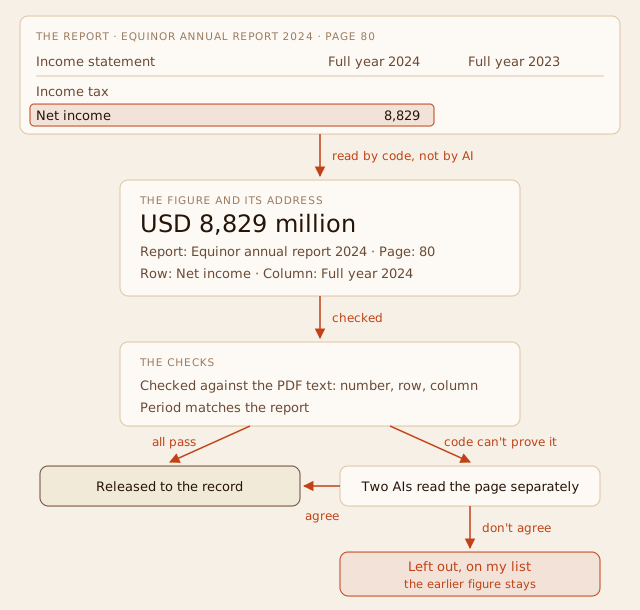
When the code can't prove a figure, it doesn't guess. It leaves the figure out, and the one from before stays where there is one. Some of those get a second try: two different AI models read the original page separately, and the figure only goes in if they agree and it passes the same checks. What's still left out goes on a list for me.
Here is that figure in the app. Open it and you see the report it came from, the page, and the line on that page it was read from.
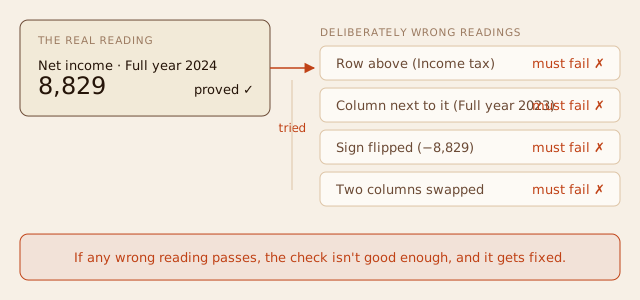
Equinor · Income statement · 2024 Net income for 2024: USD 8,829 million Read by the new table reader from page 80 of Equinor's 2024 annual report, and matched against the official ESEF filing. See the figure and its source →The part I like best is how I test the checker itself. Before a company's reports go live, I run it on deliberately wrong readings: the row above, the column next to it, the sign flipped, two columns swapped. Every one of those has to fail. If a wrong one passes, the check isn't good enough, and I fix it first.
Where a company publishes an official machine-readable version of its accounts, I compare against that too. In Europe that's ESEF, which listed companies must use for their annual reports. Every figure the reader took from Equinor's and Mowi's 2024 annual reports, 116 of 116, matched it in amount and period.
Some figures have to be there: what the company sells, what it earns, what it owns and owes, and the cash it generates. A company's recent reports, about the last eight quarters and two annual reports, need those in place before I count the company as complete. If a smaller figure can't be confirmed, it stays a gap until it can be. I'd rather show you a gap than a wrong number, because a wrong number looks just like a right one.
There are thousands of figures for a single company, far too many to go through by hand, so nobody is asked to approve them one by one. If I spot a wrong one, I can still reject it.
What the report says in words
A figure tells you what happened, not why. Revenue went up 52%; the number won't tell you whether that came from one big order, a price rise or a lucky quarter.
That's in the words: what management says, what it chooses to emphasise, what it leaves out, and how all of that changes from one quarter to the next. I keep coming back to those explanations as I follow a company.
The app sorts what a report says into five kinds of findings. A finding is a short statement the AI writes from the report, with a link to the passage it came from. The examples below are findings from my record of Napatech, all about one story I've followed for years: its design wins, the deals where a customer builds Napatech's cards into its own product.
Business profile. What the company sells, what it makes, and anything else that defines it as a business. From 2024: "Design-win focused business model targeting high-volume programs with tier-1 customers."
Management commentary. What management says, and the reasons it gives. From Q1 2024: "Increased design-win guidance from 30-40k to 50-60k in annual production volume."
Strategic position. How the company plans to get where it wants to be. That includes its targets and what management says could help or stop it reaching them. From 2024: "transformed from a niche supplier to a high-volume partner in a high-growth market." That one sentence tells you how the company sees itself, and what has to happen for it to be true.
Risks. What could go wrong. That part is easy to understand. The challenge is finding the risks that matter in a haystack of generic ones and boilerplate legal language. One that turned out to matter, from late 2023: "Long design win cycles (18 to 24 months) could delay revenue realization from new products."
Entities. Who the company works with, and how they are connected to it: customers, suppliers, partners and the legal entities around it. From 2025, Napatech's new design-win customers: "Tier-1 server vendor, d-Matrix, Broadcom Symantec, Eideticom, Myrle.AI, Xelera, A5G and more." Note the first one has no name, and that's worth knowing too.
All of it, the figures and the findings, makes up my record of a company, every piece tied to its source. I use it to find a passage without reading the whole report again. Huginn, the AI assistant in the app, works from the same record. When I asked it why Napatech still loses money with gross margins near 70%, it answered from these findings, with every source attached.
How a story builds
On its own, each finding is a statement from one report. Lined up over the years, they tell a story that no single report does. The design-win thread in my record links findings from four years of Napatech's reports. Huginn proposed the links and I confirmed them. This is what they show.
It starts in 2022 with a promise: new design wins would "significantly increase 2023 revenues", and the pipeline held more than $750 million in opportunities. Through 2023 and 2024 the wins kept coming, a record 36 of them in 2024. The targets kept changing too. The volume Napatech said its design wins could reach at peak went from 30–40,000 units a year to 50–60,000, then 40–60,000, then 60–80,000. The time it takes a win to turn into volume stretched from 18–24 months to one to three years. By 2025 the pipeline was described as nearly $400 million, possibly measured on a different basis, and late that year the company raised money to support it.
Then, in 2026, the hard events: a first production order for 1,000 units in May, and a follow-on for about 2,000 in August.
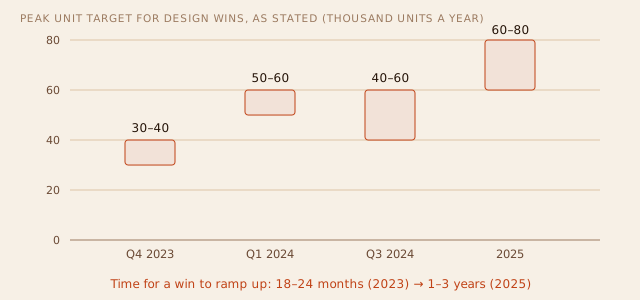
Each quarter's wording reads confidently on its own. Lined up, you see the targets change several times and the timeline stretch before the orders arrived in 2026.
The number of design wins is impressive for a company Napatech's size: 36 in 2024, 27 in 2025 and 12 more in the first half of 2026. Those count every win, big and small. The company's own target for the big, high-volume ones was four to six a year. But we're told very little about the wins themselves. A few customers are named, d-Matrix among them, while the biggest ones, like the tier-one server maker, stay anonymous. And there is no real timeline from a win to revenue, only that it takes one to three years.
So for me this is a story about when it all comes together, and that is looking more and more like 2027: the follow-on order is due to ship from the first quarter of that year. Some milestones have been reached and others are still to come, but overall I think the risk is coming down. DNB Carnegie said much the same when it started covering Napatech in June, right after the first production order: the company had become considerably less risky, and the stock offered "a very asymmetric risk/reward profile".
Napatech · Design-win thread The design-win pipeline, Q2 2022 to Q3 2026 Four years of findings from Napatech's reports, each with its source. Read the thread and its sources →When the story changes
When a company changes the story it tells, even by a few words, I want to notice. Here is the same record, one quarter apart: Napatech's own words in the Q1 report in May and the Q2 report in August.
| Q1 2026 (May) | Q2 2026 (August) | |
|---|---|---|
| Units guidance | 8,700–10,700; "with performance in the middle of the guided ranges… units sold around 9,700" | 7,700–9,700 "following product mix" |
| AI | "Design wins remain a key driver of future revenue" | "lower units to be sold within the AI Infrastructure segment in 2026 than originally anticipated" |
| Revenue guidance | DKK 200–240m | DKK 200–240m |
It's never a good sign when guidance is cut. The first question is why. What has happened, and what happens now? Will the share price suffer for a long time? A downgrade raises a whole list of questions at once.
That is exactly where the words matter. In Q1 Napatech still expected around 9,700 units; three months later the range was cut, and the explanation had changed: a shift to higher-priced products, and fewer AI units this year than planned. Revenue guidance didn't move. Putting the two quarters side by side is how I start answering those questions, instead of reacting to the headline.
Risks
Risks are the least interesting part of the written record, at least the way most reports present them. A report in the app has 43 risks on average. When I had 1,500 of them graded, only about a third were specific to the company. The rest were risks for the whole sector, risks almost any company has, legal boilerplate, or not risks at all, just results that had already happened.
Generic doesn't mean unimportant, though. Every company with debt has interest-rate risk, and for most of them it's a line you can skip. For a company with a lot of debt coming due, it may be the risk that matters most. So I'm working on sorting each company's risks down to the few that are specific to it, and flagging a generic one when the company's own numbers show it is more exposed than most.
For Napatech, I went through all the risk findings and approved them one by one. Somewhere in there was the line "Products for AI infrastructure come with a lower gross margin". I can't honestly say why I started to focus on the margin question. But it was in front of me because the risks were in my record, and I read them.
That line became the one question I asked on the Q2 call.
The AI still gets things wrong sometimes, which is why every finding shows the passage it came from. If one doesn't match, reject it, and that's all you need to do. If you find a bug, or want a feature or a tool that could do more, tell me through Help & Feedback in the app, or send me a message in Yggdrasil, the app's chat room.